
Fig. 1.
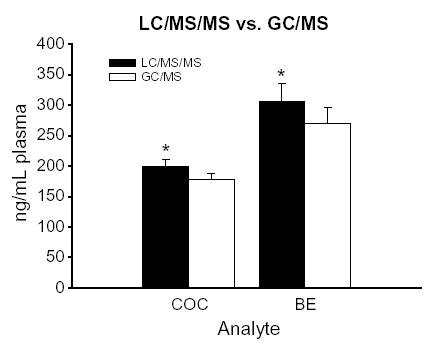
Plasma levels of COC and BE determined by LC/MS/MS (black bars) and GC/MS (white bars) for postpartum dams (n =22) sacrificed 1 –3 h after an injection of cocaine (10 mg/kg, subcutaneously). Plasma COC and BE levels were averaged over the 3-h post-injection period for direct comparison. Each bar represents the mean ± S.E.M. in units of ng/mL plasma. Plasma levels of COC and BE were significantly higher when the samples were analyzed by LC/MS/MS versus when they were analyzed by GC/MS. An asterisk denotes a statistically significant difference ( p <.0001) between the two analytical methods.