
Figure 2. Aβ-induced synaptic depression partially mimics and occludes mGluR long-term depression (LTD).
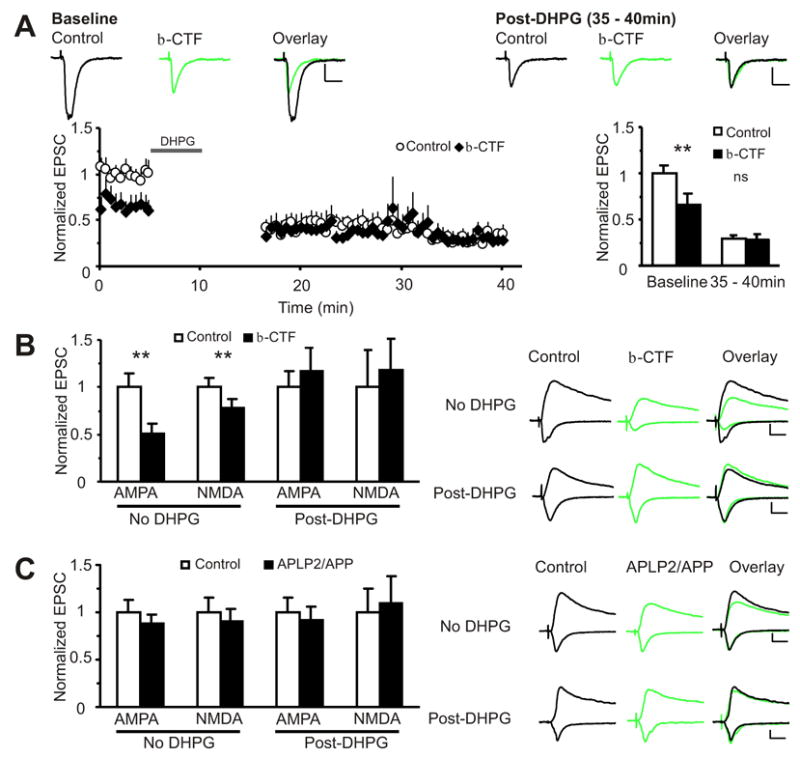
(A) Normalized EPSC amplitudes plotted against time from simultaneously patched pairs of uninfected (○) and β-CTF (♦) infected CA1 pyramidal neurons during baseline and after mGluR LTD induction (100μM DHPG, 5min) are shown on the left. Baseline and 35–40min data are summarized on the right. During baseline, the β-CTF infected neurons show depressed AMPA currents (normalized to control(pA): control: 1.0±0.08(82.7±7.0), β-CTF: 0.65±0.12(52.5±9.7), n=14, p<0.01). After DHPG, there is no difference in amplitude between control and infected neurons (normalized to control baseline(pA): control: 0.29±0.04(22.5±2.7), β-CTF: 0.28±0.06(19.6±2.4), n=9, p=0.6). Scale: 10pA, 20ms.
(B) Aβ-induced depression of NMDA currents occludes mGluR-dependent LTD. Without DHPG, AMPA and NMDA currents are depressed in β-CTF infected cells (AMPA: control: 1.0±0.15(43.9±6.4), β-CTF: 0.51±0.10(22.4±4.3), n=16, p<0.01; NMDA: control: 1.0±0.10(29.1±3.0), β-CTF: 0.78 ± 0.09(22.7±2.6), n=15, p<0.01). After 5 min of 100μM DHPG, AMPA and NMDA currents are equivalent between control and infected neurons (AMPA: control: 1.0± 0.13(26.2±3.5), β-CTF: 1.12±0.18(29.4±4.7), n=17, p=0.8; NMDA: control 1.0±0.3(5.4±1.7), β-CTF: 1.3±0.3(6.8±1.5), n=16, p=0.2).
(C) The APLP2/APP construct does not affect mGluR LTD induction. There is no difference in amplitude between control and infected cells before (AMPA: control: 1.0±0.13(47.0±6.3), APLP2/APP: 0.87±0.10(41.4±4.7), n=17 , p=0.3; NMDA: control: 1.0±0.16(24.9±3.9), APLP2/APP: 0.90±0.13(22.4±3.3), n=13, p=0.08) and after 5 min of 100μM DHPG (AMPA: control: 1.0±0.16(36.8±5.9), APLP2/APP: 0.92±0.14(33.9±5.0), n=13, p=0.3; NMDA: control: 1.0±0.25(35.8±8.8), APLP2/APP: 1.1±0.30(39.1±10.6), n=12, p=0.8). All p values from Wilcoxon test. All data are reported as mean ± SEM. **=p<0.01. Scale: 20pA, 20ms.