
Figure 3.
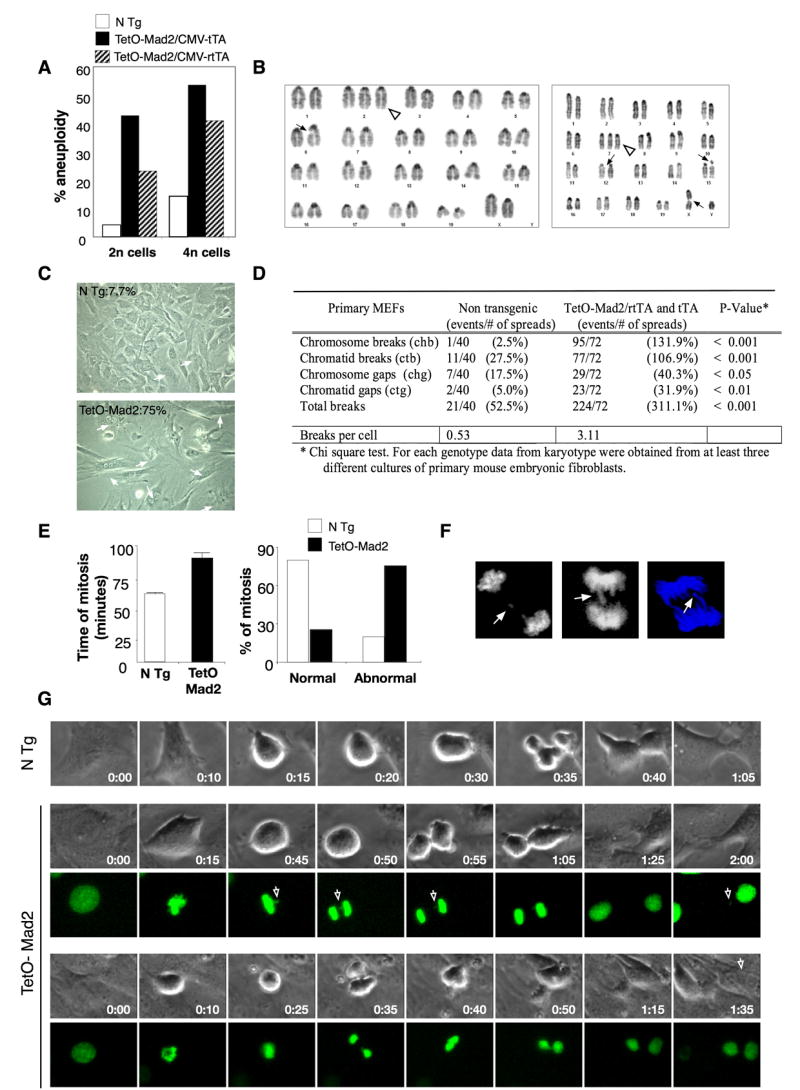
Overexpression of Mad2 leads to chromosomal instability. (A) Percentage of aneuploidy in the 2n and 4n population in TetO-Mad2 overexpressing MEFs in the Tet-On and Tet-Off systems. (B) Karyotype of a Tet-On cell with an extra chromosome (2) (white triangle) and a chromatid break (6) (ctb) (left panel), and karyotype of another cell with an extra chromosome 7 (white triangle), a ctb (X), ctb (15) and chromatid gap (ctg) (12) (right panel). (C) Representative picture of Tet-On P2 MEFs in culture showing binucleated cells (white arrows). (D) Number of chromosomal breaks on primary MEFs. (E, right panel) Time of mitosis of non transgenic (n = 98) and TetO-Mad2 (n = 90) MEFs was followed by time-lapse microscopy. Mean time of total mitosis is shown. (E, left panel) Percentage of cells with normal or abnormal mitosis (binucleated cells, furrow regression, chromosome bridges and mitotic catastrophe) as assessed by time-lapse microscopy. (F) Evidence of lagging chromosomes (top panel) and chromosome bridges (bottom 2 panels). (G) Time-lapse micrography of non transgenic and TetO-Mad2 MEFs. (Upper) N Tg cell entering mitosis at T=0 min and completing cytokinesis by 1 hour. (Middle) Representative cell overexpressing Mad2 with a chromosome bridge (white arrow) stays longer in mitosis and exits at 1hr 25 min with a missegregated chromosome (arrow). (Lower) Example of a cell with a chromosome bridge that suffers furrow regression and exits mitosis as a binucleated cell.