
Fig. 3.
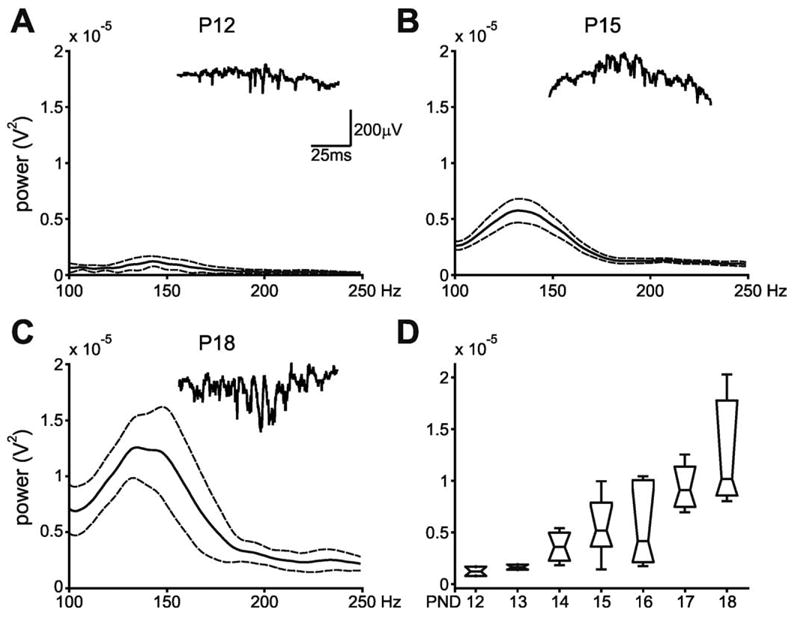
(A–C) Multi-taper analysis of wide band-detected SPW-associated activity for three selected age groups in freely moving animals. SPW-associated events were analyzed only during immobility and SWS periods. Note that fast field “ripple” oscillations do not begin to appear until after the second week of life. Solid/dotted lines: mean ± S.E.M. Insets: Wide band traces from CA1 str. pyramidale of detected SPW-associated events for each age in single rats. (D) Group results. Peak power in the 140–200 Hz frequency band across all age groups in freely moving animals. Note the increase in power of the peak ripple frequency as age increases. Horizontal lines indicate the mean at each age. Boxes show the distribution of the data. Error bars: ± S.E.M.