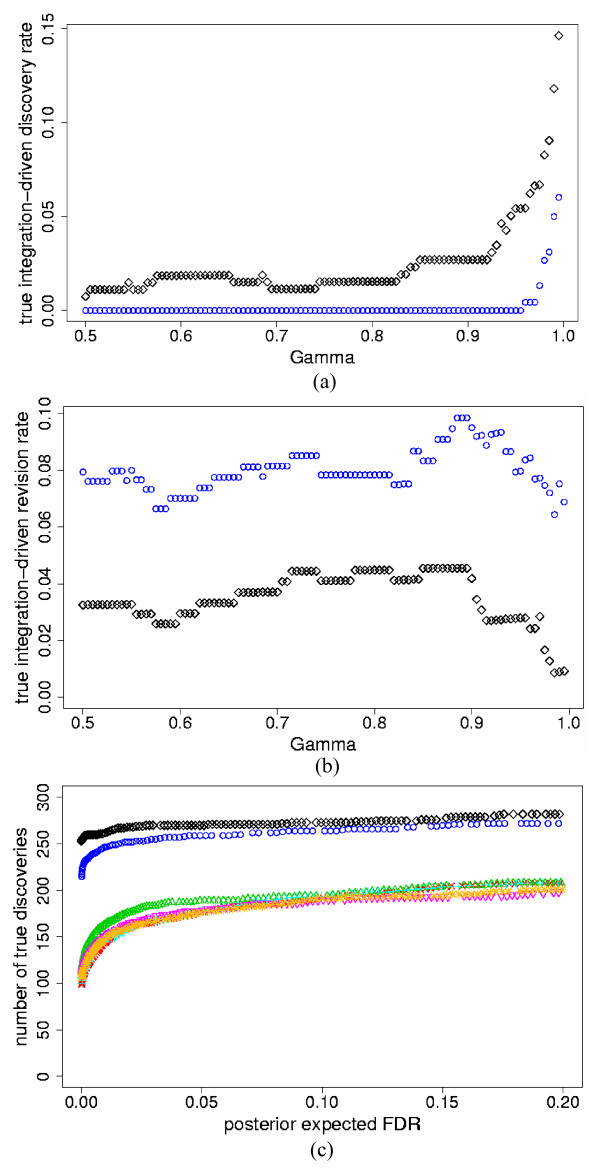
Figure 4.
tIDR, tIRR and true discovered genes versus peFDR for the five-study simulation data. a) True integration-driven discovery rate (tIDR) versus threshold values of posterior probability of differential expression γ ≥ 0.50, for the standardized expression integration model (blue circles) and probability integration model (black diamonds) for the five-study simulation data with high mean = 0.7 (differentially expressed); 0.07 (non-differentially expressed) and simulated percent differentially expressed genes ps = 10%; b) True integration-driven revision rate (tIRR) versus threshold values of posterior probability of differential expression γ ≥ 0.50, for the standardized expression integration model (blue circles) and probability integration model (black diamonds) for the five-study simulation data with high mean = 0.7 (differentially expressed); 0.07 (non-differentially expressed) and simulated percent differentially expressed genes ps = 10%; c) The maximum number of true discovered genes versus posterior expected false discovery rate (peFDR) for the standardized expression integration model (blue circles), probability integration model (black diamonds), individual analyses of Study 1 (red checks), Study 2 (green triangles), Study 3 (turquoise pluses), Study 4 (pink inverted triangles), Study 5 (gold stars) for the five-study simulation data with high mean = 0.7 (differentially expressed); 0.07 (non-differentially expressed) and simulated percent differentially expressed genes ps = 10%.

