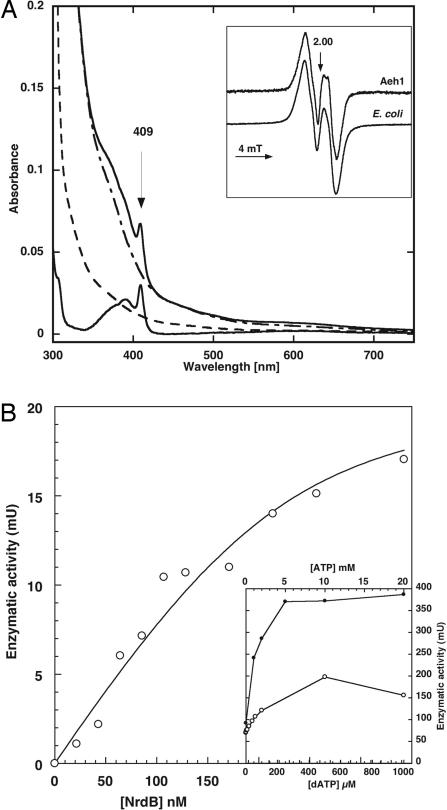
Fig. 4.
Enzyme activity of Aeh1 NrdA-a/NrdA-b and NrdB proteins. (A) Uv-vis spectra of 18 μM Aeh1 NrdB protein: as purified (dashed line), after iron reconstitution (upper solid line), after iron reconstitution and scavenging of tyrosyl radical by 10 mM hydroxyurea treatment (dash-dotted line), subtraction of before and after hydroxyurea treatment (lower solid line). (Inset) Electron paramagnetic resonance spectrum of iron reconstituted Aeh1 NrdB (45 μM protein, 0.47 radical/dimer) and E. coli NrdB. (B) Titration of enzyme activity in presence of increasing concentrations of Aeh1 NrdB. Curve fitting was performed as described (42) and gave KD 0.034 ± 0.057 μM (the enzyme activity level required an Aeh1 NrdA-a/NrdA-b concentration of 0.22 μM, which results in high standard error). (Inset) Titration of enzyme activity in presence of increasing concentrations of ATP (filled circles) and dATP (open circles).

