Fig. 4.
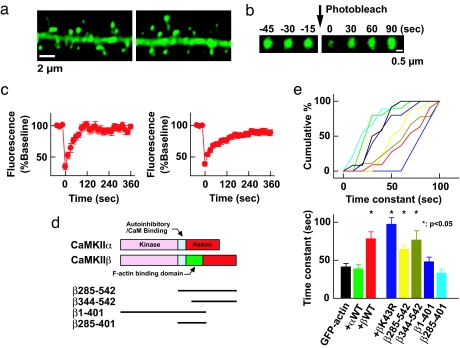
Interaction between actin and CaMKII slows down the turnover of actin in the dendritic spine. (a) Images of dendritic segments expressing GFP-actin with (Right) or without (Left) untagged CaMKIIβ. (b) An example of FRAP assay. Images shown are time-lapse of single dendritic spine head expressing GFP-actin before and after photobleaching. (c) Averaged FRAP of GFP-actin alone (Left) and GFP-actin coexpressed with untagged CaMKIIβ (Right). The first time point after photobleaching was taken as time 0. (d) CaMKIIβ deletion mutants used in FRAP assay. (e) Effect of CaMKIIα, CaMKIIβ, βK43R, and deletion mutants of CaMKIIβ to the time constant of GFP-actin FRAP. The time course of FRAP in individual spine was obtained by fitting with a single exponential curve and plotted. (Upper) Plots of the same data. (Lower) Cumulative plot of the time constant (sec). Bin size is 10 s. The same color code is used in both graphs. The number of spines were as follows: GFP-actin only, 13; CaMKIIα, 11; CaMKIIβ, 12; CaMKIIβ K43R, 9; β1–401, 11; β285–401, 10; β285–542, 11; β344–542, 10. ∗, Statistical significance compared with GFP-actin only (P < 0.05).

