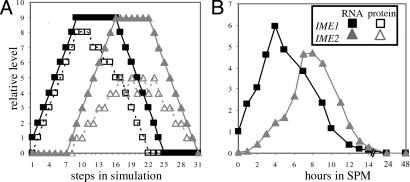
Fig. 2.
The model faithfully describes the meiotic pattern of expression of IME1 and IME2. (A) Simulation of the network presented in Fig. 1 when N = 9. The initial state of IME1 RNA was 1, that of Ume6/Rpd3 was 9, and the rest were 0. (B) Wild-type diploid cells (Y422) were shifted to meiotic conditions (SPM), and RNA was isolated at the indicated hours. The level of IME1 and IME2 RNA was measured by quantitative PCR. Filled squares, IME1 RNA; open squares, Ime1; filled triangles, IME2 RNA; open triangles, Ime2.

