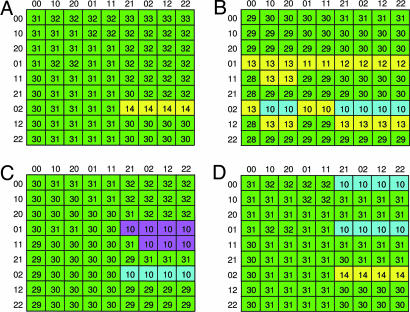
Fig. 4.
Karnaugh-like maps. Shown is the functional dependence between initial states and the type of behavior of the trajectory, for four hypothetical networks. (A) Null hypothesis network as illustrated in Fig. 1. (B) Deletion of edge from Ime2 to the edge from Ime1 to X. (C) Addition of negative edge from Ime2 to IME1; Ime2 affects IME1 directly. (D) Addition of a positive edge from Ime2 to X; Ime2 affects X directly. Each cell in the tables represents a specific initial vector. The rows of the tables are indexed by the initial states of IME1 RNA and proteins, respectively, and the columns are indexed by the similar states of IME2. The numbers in the cells state the length of the trajectory of the corresponding initial vector. The cells are marked by different colors representing the following four types of trajectories' behavior (see SI Fig. 6): normal transient expression (green); restrained expression with weak transience (yellow); short trajectories, expression not induced (purple); and IME1 expression is weak but transient, whereas IME2 is not expressed or expressed before Ime1 (turquoise).

