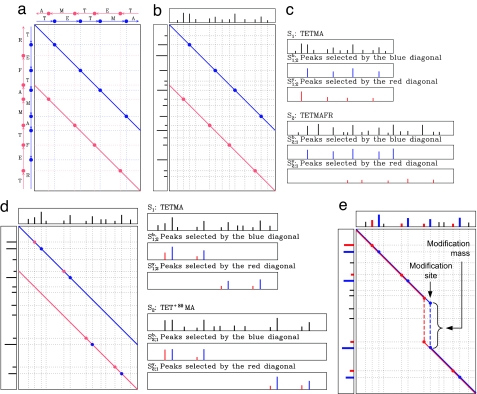
Fig. 3.
Spectral products for terminal and internal modifications. (a) Spectral product for the theoretical spectra of the peptides TETMA and TETMAFR (all points at the intersections between the vertical and horizontal lines). The blue circles correspond to matching b ions in the two spectra; the red circles correspond to matching y ions. The blue and red circles are located on the blue and red diagonals. (b) Spectral product for uninterpreted spectra of the peptides TETMA and TETMAFR. The two diagonals in the spectral product matrix still reveal the points at which peaks from the spectrum at the top match peaks from the spectrum on the left. (c) Spectra S1,2b and S1,2y defined by the blue and red diagonals. (d) Spectral product for uninterpreted spectra with one internal modification. The top spectrum corresponds to an unmodified peptide, and the left-side spectrum corresponds to a modified peptide. In these cases it is not appropriate to construct Si,jb/Si,jy by simply selecting peaks on the diagonals. (e) The algorithm described in the text allows for modifications to occur in the middle of the peptide and separates the overlapping series of b and y ions (blue and red diagonals, respectively). The peaks selected from each spectrum by the blue/red diagonals are shown in the corresponding color.

