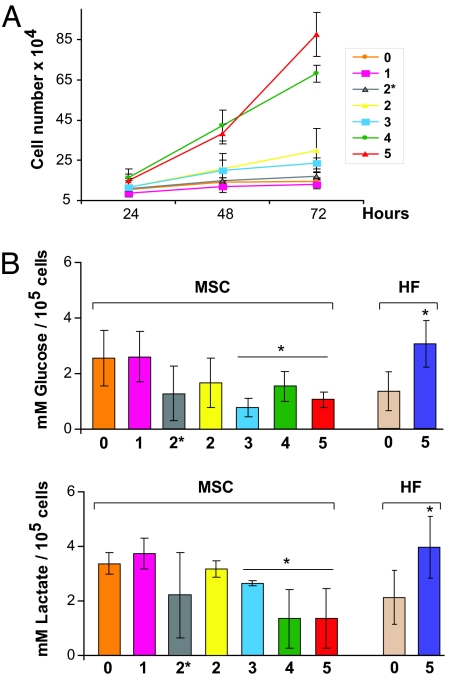
Fig. 3.
Functional assays of bioenergetic pathways during stepwise transformation. (A) Growth curve showing the number of cells at 24, 48, and 72 h. Lanes 0–5 indicate cells with different number of genetic hits (see Table 1). (B) Values of glucose uptake and lactate release at 48 h corrected for cell number in MSC and HF during stepwise transformation (∗, P < 0.05; Student's t test). Lanes 0–5 indicate parental cells (0) and each subsequent step in transformation.

