
Figure 1.
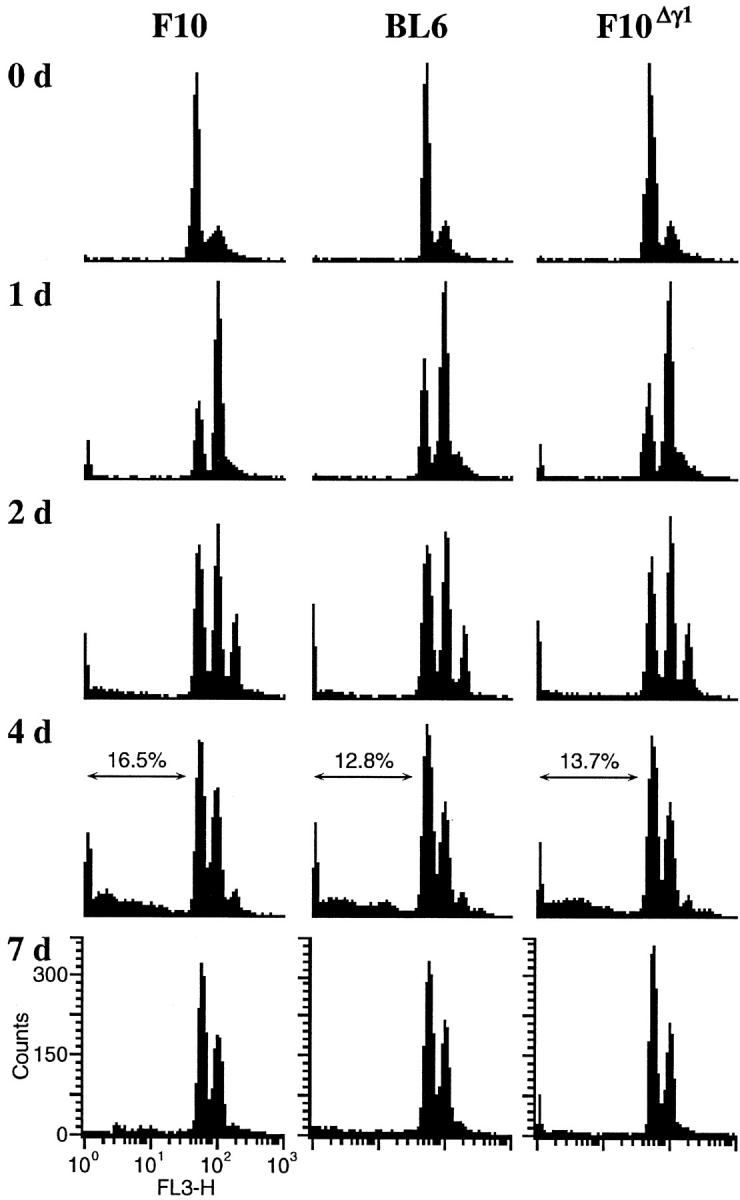
Cell-cycle response of F10, F10Δγ1, and BL6 cells to in vitro γ-irradiation. Cells were grown in vitro and γ-irradiated by a single 8-Gy dose. On the days indicated after irradiation, cells were harvested, stained with PI, and examined by FACS. The proportion (%) of cells with a sub-G1 DNA content is shown at the top of some histograms.