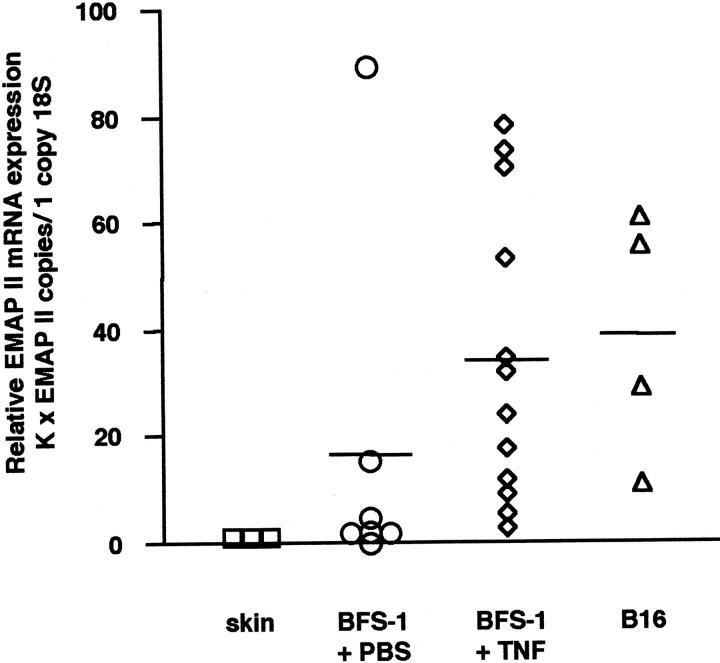
Figure 2.
Relative EMAP II mRNA expression in tumors quantitated by real-time PCR. For relative quantitation, the EMAP II gene was normalized to the internal control gene 18S rRNA as described in Materials and Methods. Skin tissue (n = 3; mean = 1) surrounding the subcutaneously implanted tumors was negative for EMAP II mRNA. In contrast, a low mean EMAP II mRNA expression was detected in control BFS-1 fibrosarcomas after PBS-treatment (n = 7; mean = 16.6). Treating mice for 24 hours with TNF (n = 12; mean = 34.3) led to a significant increase in intratumoral EMAP II mRNA levels compared to the control tumors (EMAP II, P = 0.036; Mann-Whitney two-sample rank test). The relative EMAP II mRNA expression in B16 melanomas (n = 4; mean = 38.8) was similar to the amount of EMAP II mRNA detected in the BFS-1 + TNF group. K, constant (see Materials and Methods).

