
Figure 3.
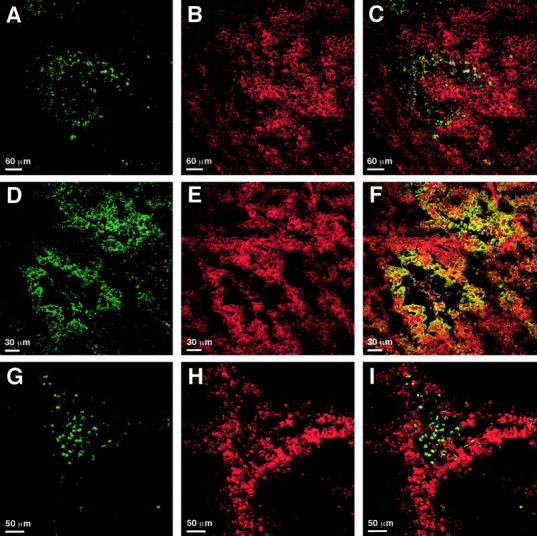
Detection of apoptosis, hypoxia, and proEMAP II/p43 expression in B16 melanomas by immunofluorescent staining and confocal laser-scanning microscopy. 5 μm sections of B16 melanomas were stained with the TUNEL technique (A and G), EMAP II- (B and E) or theophylline-specific (D and H) antisera. C, F, and I represent the merged images of the respective panels in the left and middle column. C: ProEMAP II/p43 expressing (Cy 3, red) and TUNEL-positive (FITC, green) cells partially overlap in perinecrotic areas of the tumor. High proEMAP II/p43 expression is predominantly detectable in areas that are devoid of apoptotic cells. F: Strong expression of proEMAP II/p43 (Cy 3, red) and accumulation of the hypoxia marker NITP (FITC, green) occurs in cells in perinecrotic areas of the tumor. Double-positive cells appear yellow. Most of the hypoxic cells show proEMAP II/p43 expression. I: TUNEL-positive cells (FITC, green) in perinecrotic areas are surrounded by a rim of hypoxic (Cy 3, red) cells. Of note, only double-staining of proEMAP II/p43- positive and hypoxic cells gives rise to a full (yellow) overlay due to the common cytosolic expression of these antigens in the cytosol, whereas this is not the case for overlays with TUNEL, which stains the nuclear compartment. For technical reasons, hypoxic cells are visualized in green color in panels D and F, whereas they appear red in panels H and I.