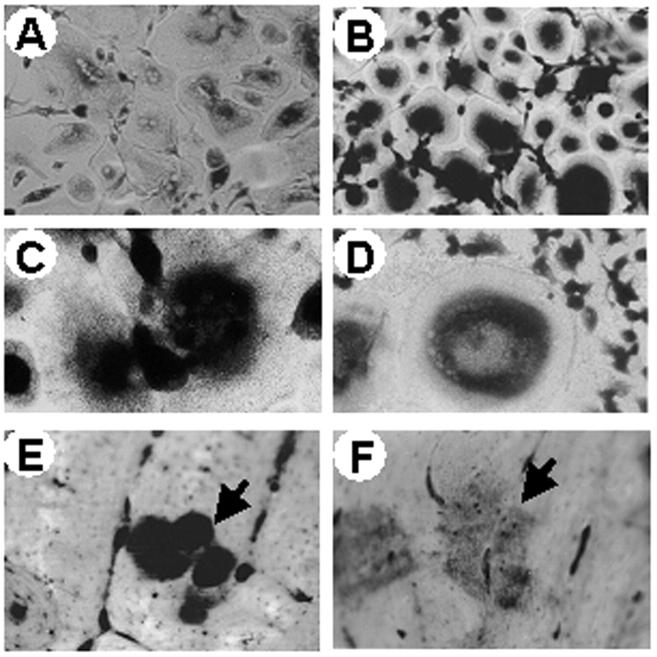
Figure 9.
In vitro peripheral blood osteoclasts. Osteoclasts were generated in vitro from controls and patient 1 as described in Materials and Methods. A: Control culture showing several TRAP-positive osteoclasts. B: Patient’s culture showing similar number of osteoclasts with a strongly positive TRAP reaction. C: Patient’s culture at higher magnification showing strong TRAP positivity. D: Patient’s post-BMT osteoclasts showing less pronounced TRAP activity relative to the pre-BMT osteoclasts depicted in C. E: Pits (arrow) excavated by control osteoclasts showing regular morphology and intense toluidine-blue staining. F: Pits (arrow) excavated by the patient’s osteoclasts showing irregular edges and pale staining relative to control pits. Original magnifications: ×25 (A and B); ×40 (C–F).

