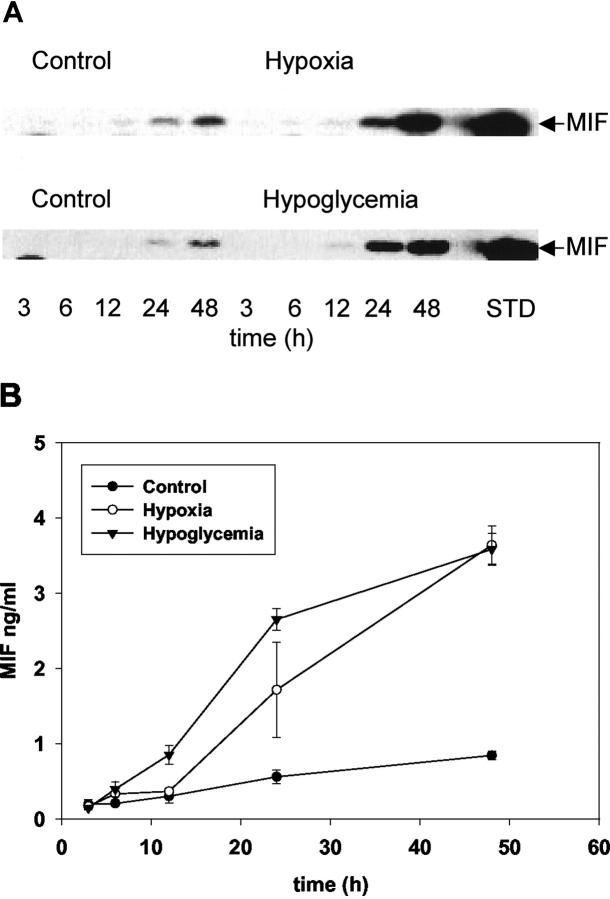
Figure 5.
Analysis of extracellular MIF production in normal LN18 cells, and after hypoxic or hypoglycemic conditions by Western blot (A) and ELISA (B). A: Supernatants were prepared as described in Materials and Methods. Ten-μl aliquots of the supernatants at the indicated times were electrophoresed and transferred onto nitrocellulose membranes and the MIF content was analyzed by reaction with an anti-MIF antibody as described in Materials and Methods. Recombinant MIF (50 ng) was electrophoresed as standard (STD). B: MIF release was analyzed by sandwich ELISA of supernatants collected at the indicated time points from control cells (filled circles), after hypoxia (open circles), and after hypoglycemia (inverted filled triangle). Measurements were performed in triplicate cultures; the data shown are the mean ± SD of one representative experiment of a group of five separate experiments with similar results.

