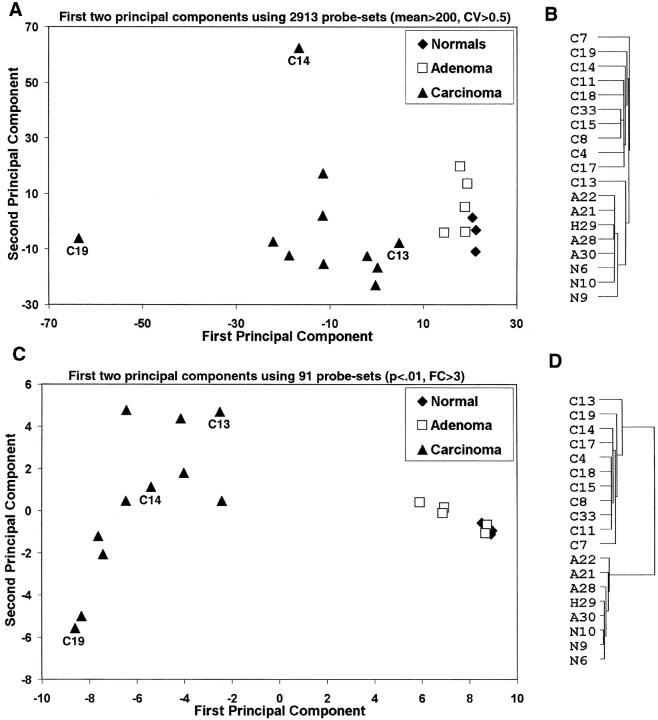
Figure 1.
Probe sets (n = 2913) with mean expression greater than 200 and SD divided by the mean >0.5 for the entire data set were selected. A: First two principal components for these probe sets. Probe sets were standardized by subtracting the mean and dividing by the SD. B: Dendrogram from average clustering 62 using these probe sets. C and D: Similar principal components and dendrograms using only 91 probe sets with a fold change greater than three between the carcinoma and normal/adenoma cohorts with a P < 0.01 in both cases.

