
Figure 2.
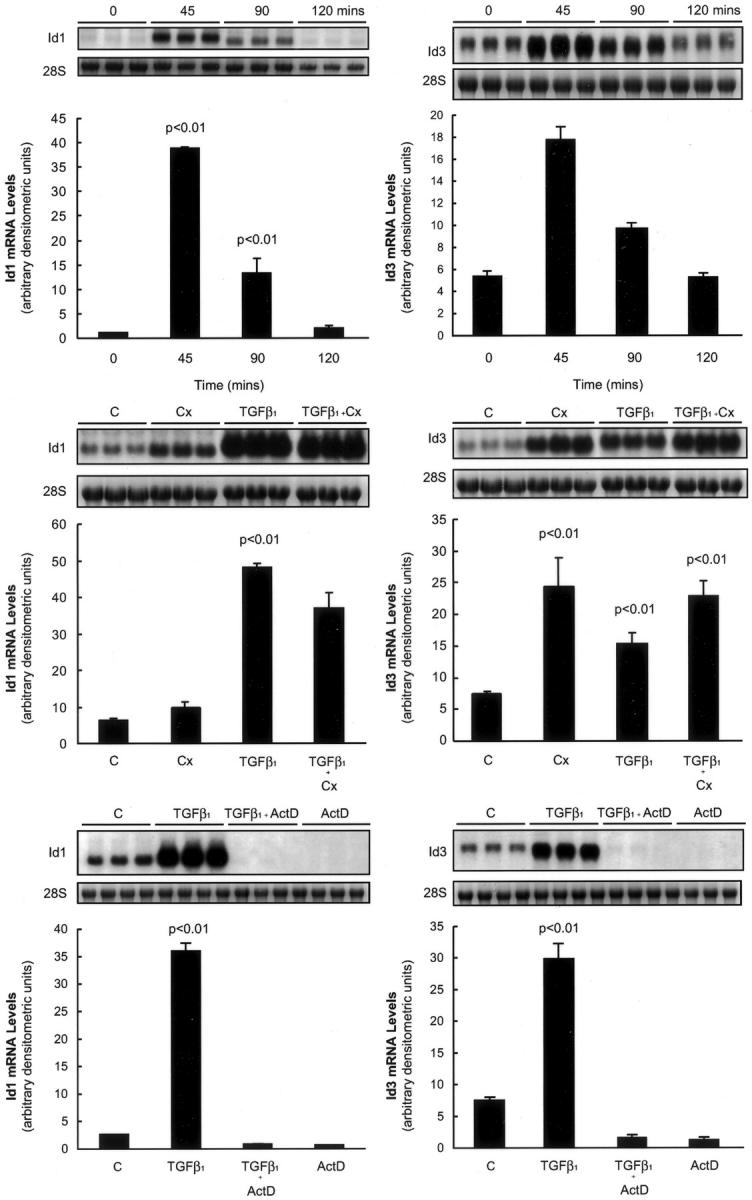
ID1 and ID3 behave like direct TGF-β1 target genes. Top: The effect of TGF-β1 on ID1 and ID3 mRNA levels over time assessed by Northern analysis. Middle: The effect of cycloheximide on TGF-β1-induced ID1 and ID3 mRNA levels. Bottom: The effect of TGF-β1 on ID1 and ID3 mRNA levels in cells pretreated with actinomycin D. Data for HFL-1 fibroblasts fetal is shown on the left; whereas the right shows data for primary adult lung fibroblasts (pHALF). Bar graphs represent the mean of three replicate cultures. Also shown are representative phosphorimages of the ID1 and ID3 transcripts and corresponding images of the 28S rRNA bands. P values represent comparisons made to serum-free media control-treated cells.