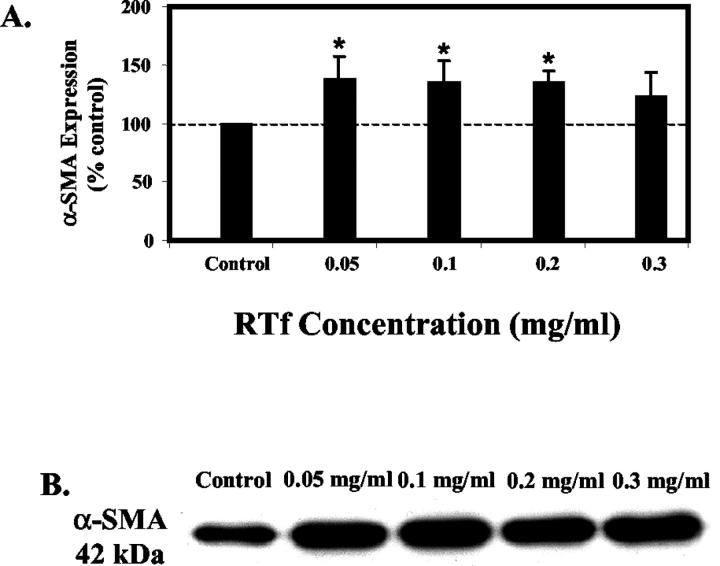
Figure 5.
Expression of α-SMA in HSC. A: HSC were treated with increasing concentrations of RTf and collected after 7 days in culture and quantitated using scanning laser densitometry following Western blotting. (B) Representative Western blot of HSC cell extracts (10 μg cell protein/lane) showing 42 kd band corresponding to α-SMA. Results are mean ± SE, n = 4. *P < 0.05 when compared to control.

