Figure 7.

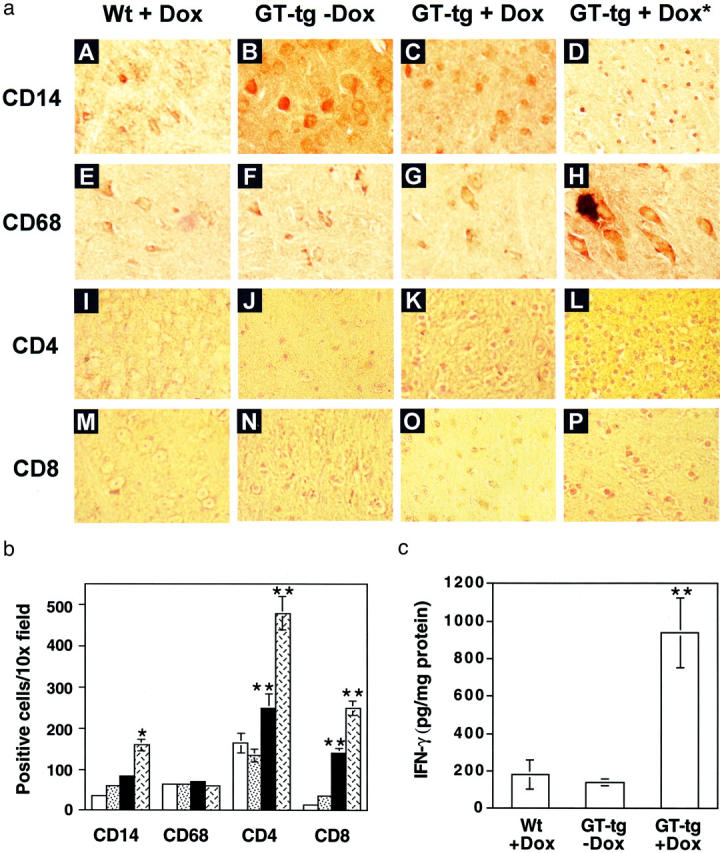
The CNS infiltration induced by Tat expression. a: Increased staining of CD14-, CD4-, and CD8-positive, but not CD68-positive cells in the brain of Tat-expressing mice. The serial sections of the brain of the wild-type mice treated with Dox, the GT-tg bigenic mice treated with or without Dox, and the dead GT-tg bigenic mice resulting from Dox treatment (shown as GT-tg + Dox*) were immunolabeled with anti-CD14 antibody (A–D), anti-CD68 antibody (E–H), anti-CD4 antibody (I–L), and anti-CD8 antibody (M–P). The representative images were taken in the cortex region of the brain. b: Quantitation of CD14-, CD68-, CD4-, and CD8-positive cells in the cortex region of immunolabeled sections from A. Cell countings of positively stained cells were performed as described in the Materials and Methods section. Open bars, wild-type mice treated with Dox; dotted bars, GT-tg bigenic mice treated without Dox; filled bars, GT-tg bigenic mice treated with Dox; hatched bars, dead GT-tg bigenic mice 5 days after initiation of Dox treatment. c: IFN-γ production in the brain of Tat-expressing mice. Brain homogenates were prepared from the other hemibrain of the mice as described in the Materials and Methods section. The levels of IFN-γ production in the brain homogenates were determined by ELISA. Data represent means ± SEM of mice in each group (b and c).
