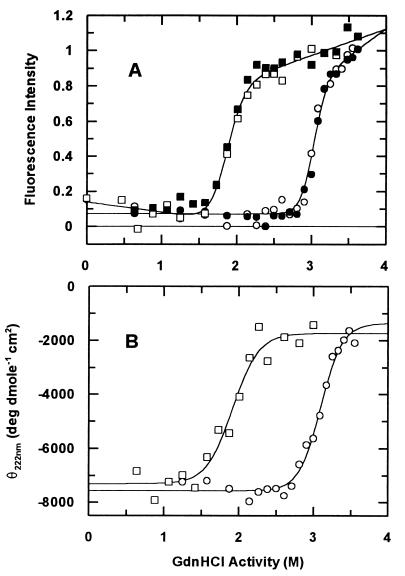
Figure 3.
Equilibrium unfolding in GdnHCl. The unfolding curves of Fox (○) and Fred (□) are shown as probed by tryptophan fluorescence (A) and far-UV CD (B). (A) Open symbols, unfolding titration; filled symbols, refolding titration. Fluorescence emission was measured with a Hitachi F-4,500 spectrofluorimeter between 300 and 410 nm by using an excitation wavelength of 290 nm (slit widths were 5 nm on both excitation and emission, 25°C). Final protein concentration was 5 μM in 50 mM Tris⋅HCl (pH 7.0). Buffers for the reduced proteins all contained 20 mM DTT. (B) Far-UV CD spectra were measured as described for Fig. 2. The data were fitted to Eq. 1, and values determined for ΔGeq(F/U) and meq(F/U) are listed in Table 1.

