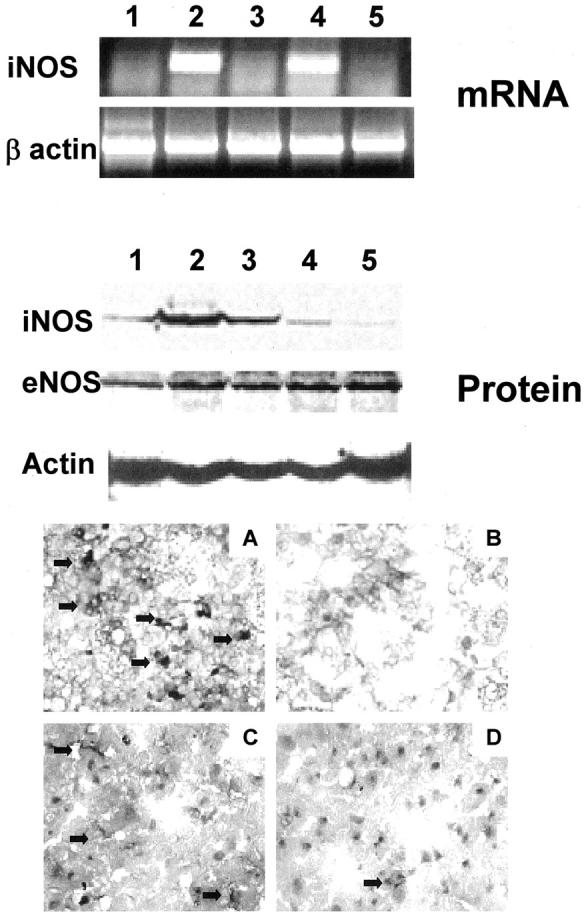
Figure 8.

iNOS expression and peroxynitrite formation in steatotic OLTs. Top: iNOS expression at mRNA level in steatotic naïve livers (lane 1) and OLTs at day 1 (lanes 2 and 3) and day 3 (lanes 4 and 5) after transplantation. Control livers (lanes 2 and 4) showed high levels of iNOS mRNA expression in particular at day 1 after OLT (lane 2). In contrast, iNOS mRNA expression was virtually absent in naïve (lane 1) and CS1-treated OLTs at day 1 (lane 3) and day 3 (lane 5). Middle: A similar result at the protein level. Control day 1 OLTs expressed high levels of iNOS (lanes 2 and 3) whereas iNOS was depressed in naïve fatty livers (lane 1) and day 1 CS1-treated OLTs (lanes 4 and 5). In contrast to iNOS, eNOS was expressed in comparable amounts between control (lanes 2 and 3) and CS1 (lanes 4 and 5) OLTs at day 1. Bottom: iNOS (A and B) and nitrotyrosine (C and D) staining in day 1 control (A and C) and CS1-treated (B and D) OLTs. iNOS staining was highly positive in infiltrating MNCs of control OLTs and almost absent in CS1-treated liver grafts. Nitrotyrosine staining was moderated and mild in control and CS1-treated OLTs, respectively (n = 3/group). Original magnifications, ×200 (A and B).
