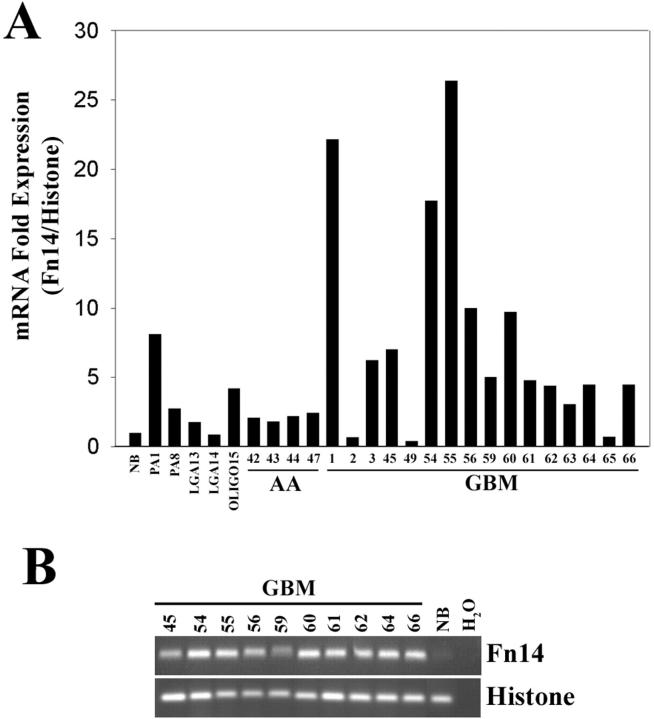
Figure 2.
Fn14 mRNA expression in various glial tissues. A: Quantitation of Fn14 mRNA expression using real-time RT-PCR. Total RNA was extracted from various glial tissues and analyzed by quantitative PCR for Fn14 mRNA and normalized to histone H3.3 expression. Fn14 expression for various glial tissues was then normalized to expression in normal brain. (NB, average Fn14 expression in three normal brain samples; PA, pilocytic astrocytoma; LGA, low-grade astrocytoma; OLIGO, oligodendroglioma; AA, anaplastic astrocytoma; GBM, glioblastoma multiforme). B: Assessment of Fn14 and histone H3.3 amplicon specificities after QRT-PCR. The PCR reaction was stopped at the exponential log phase and reaction products were separated on an agarose gel and detected by ethidium bromide staining.

