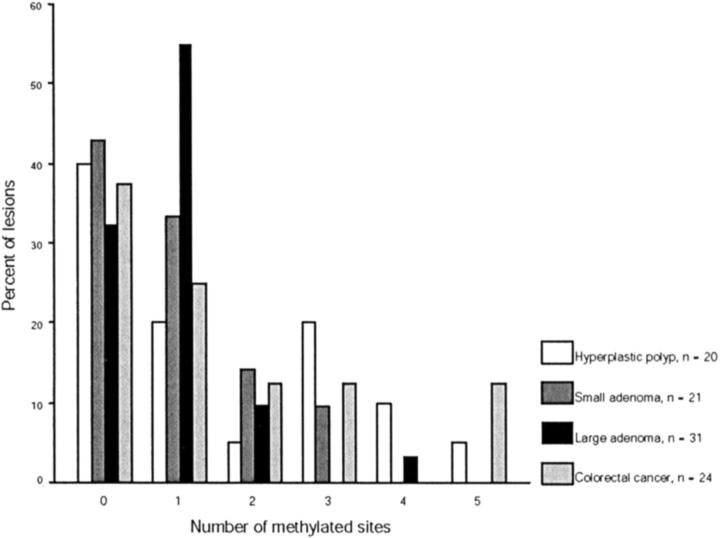
Figure 4.
Distribution of CpG island methylation in hyperplastic polyps, adenomas, and colorectal carcinomas. The histogram shows the percentage of methylated loci according to the histological type of the lesion. The MINT sites and p16 are included in the analysis. It is apparent that both small and large adenomas show a skewed distribution of methylation with 98% (51 of 52) of lesions demonstrating methylation at less than four sites. Hyperplastic polyps and colorectal cancer demonstrate a more continuous distribution of methylation with 6 of 44 lesions (14%) showing methylation at more than three sites.

