
Figure 5.
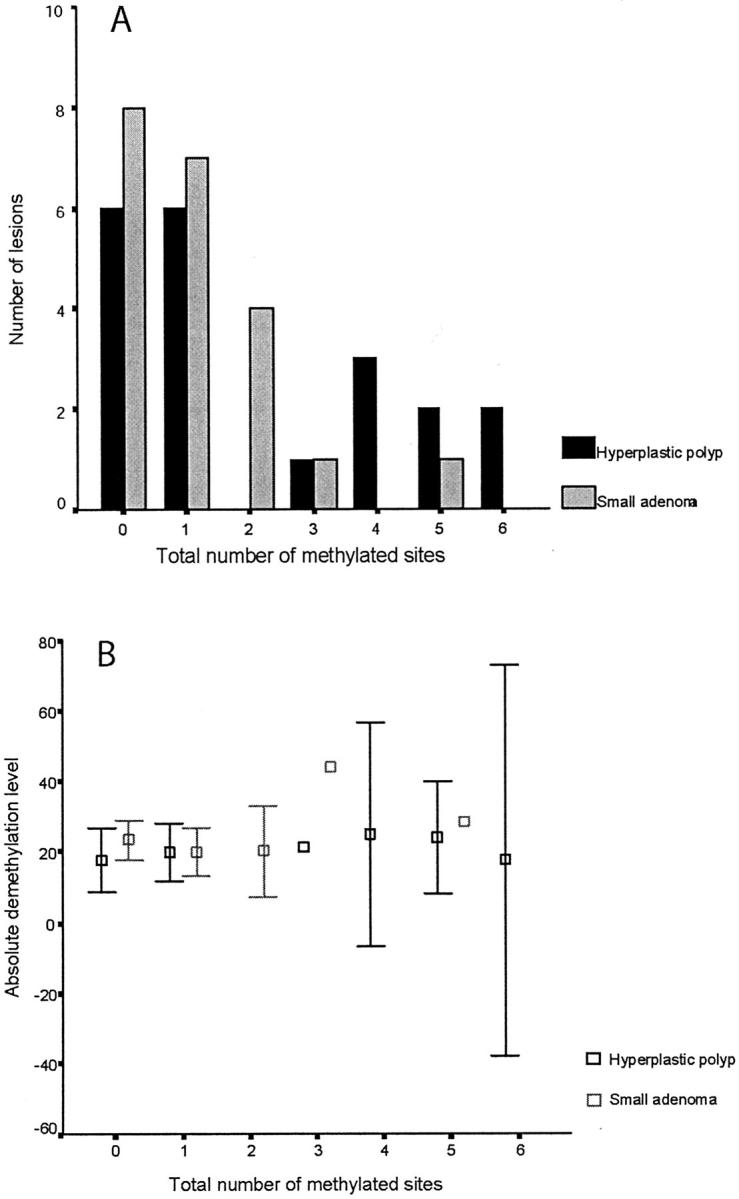
Comparison of CpG island methylation (A) and corresponding levels of hypomethylation (B) in hyperplastic polyps (n = 20) and small adenomas (n = 21). The histogram shows the number of methylated loci according to the histological type of the lesion. The MINT sites, p16, hMLH1-A, and hMLH1-C are included in the analysis, so the maximum total number of methylated sites for each lesion is seven. The absolute demethylation level refers to the percentage of methylated CpG in the sample after subtraction from the control peripheral blood mononuclear cell sample. Each sample was assayed in triplicate, and the mean decrease in absolute methylation content and 95% confidence intervals are shown. There was no relationship between the number of methylated sites and the extent of demethylation for hyperplastic polyps (Spearman’s rho, 0.32; P = 0.2) or small adenomas (Spearman’s rho, 0.08; P = 0.74).