
Figure 1.
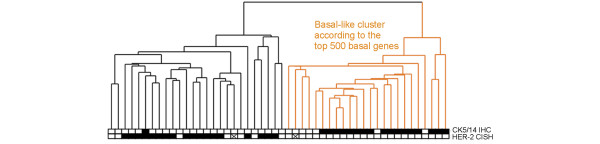
Hierarchical clustering of 50 ER-negative tumors based on the top 500 basal genes. The gene set was generated for the CK5/14-positive basal phenotype tumors. Yellow indicates the basal-like cluster and black the non-basal-like cluster. The boxes beneath indicate the immunohistochemically CK5/14-positive tumors and the HER-2 oncogene-amplified tumors (solid box, positive; open box, negative, crossed box, data missing).