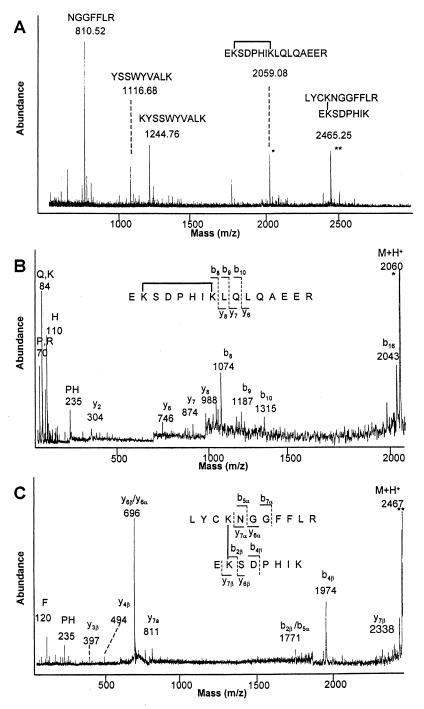
Figure 2.
Mass spectrometry. (A) MALDI-TOF spectrum from tryptic digest of BS3 cross-linked FGF-2. Cross-linked peptides are identified by using the program asap and are denoted with an asterisk (9). (B) MALDI-PSD spectrum of cross-linked peptide E45–R60 (M + H+ = m/z 2059.08). (C) MALDI-PSD spectrum of cross-linked peptides L23–R33 and E45–K52 (M + H+ = m/z 2465.25). Fragments from peptide L23–R33 are labeled with an α subscript; those from peptide E45–K52 with a β subscript. Fragments due to amide bond cleavages (b-ions, y-ions, and immonium ions) are labeled according to their single letter abbreviations. The most abundant fragments arose from cleavages at cross-linked lysines and aspartic acid. Peaks at m/z 696 and 1771 correspond to fragmentation at y6β and/or y6α, and b2β and/or b5α, respectively.

