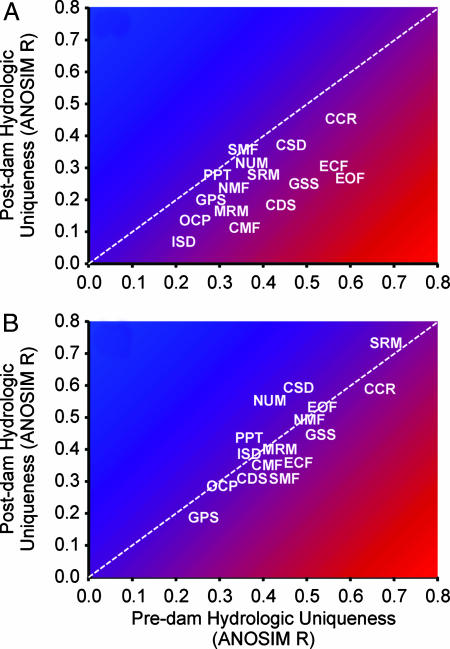
Fig. 2.
Changes in flow regime similarity for 16 regions over the course of the 20th century. (A) Data for 186 dammed rivers. (B) Data for 317 unregulated, reference rivers. x axis scores represent a region's hydrologic uniqueness before regulation (mean predam ΔR), and y axis scores are postdam uniqueness (mean postdam ΔR). The 1:1 dotted line is the expected relationship between predam and postdam flow regimes for the null hypothesis of no change over time. Regions plotting below this line have become less distinct in the postdam period (homogenization) and those above have become more distinct (differentiation) relative to other regions. See Methods for assignment of reference rivers to predam and postdam periods.

