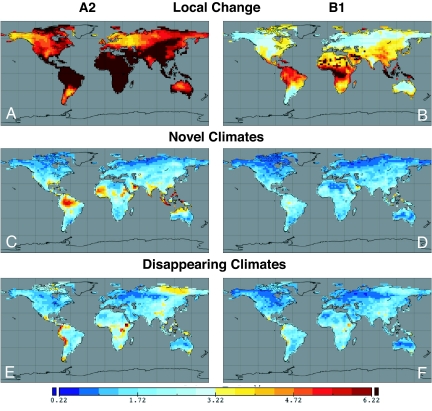
Fig. 2.
Mapped indices of climate change risk for local climate change (A and B), novel 21st-century climates (C and D), and disappearing 20th-century climates (E and F). (A) Local climatic change for the A2 scenario, represented by the SED between the 20th- and 21st-century climate realizations for each gridpoint. The color bar is scaled so that SED→SEDt (see Materials and Methods) are yellow to red. (B) As in A but for the B1 scenario. Locally high values over the Sahara, Arabian Peninsula, and southwestern Asia are an artifact of zero precipitation and precipitation variance simulated by the MRI–CGCM2.3.2 and CCSM3 models. In other models, the SED scores for these locations are similar to those of neighboring gridpoints. (C) Maps of the SEDmin between the 21st-century realization for each gridpoint and the set of 20th-century climate realizations (A2 scenario). High dissimilarities indicate risk of novel climates. (D) As in C but for the B1 scenario. (E) Maps of the SEDmin between the 20th-century realization for each gridpoint and the set of 21st-century climate realizations (A2 scenario). High dissimilarities indicate risk of disappearing climates. (F) As in E but for the B1 scenario. (C–F) The pool of potential climatic analogs is global.

