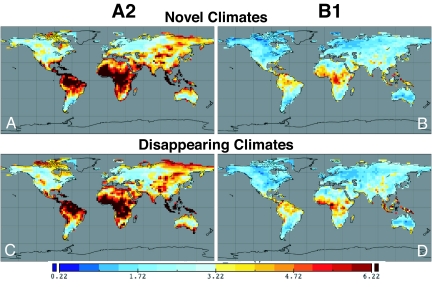
Fig. 3.
A–D correspond to C–F in Fig. 1, except, here, the pool of potential analogs is restricted to gridpoints within 500 km of each target gridpoint. (A) SEDmin between the 21st-century realization for each gridpoint and the set of 20th-century climate realizations (A2 scenario). High dissimilarities indicate risk of regionally novel 21st-century climates. (B) As in A but for the B1 scenario. (C) SEDmin between the 20th-century realization for each gridpoint and the set of 21st-century climate realizations (A2 scenario). High dissimilarities indicate risk of regionally disappearing 20th-century climates. (D) As in C but for the B1 scenario.

