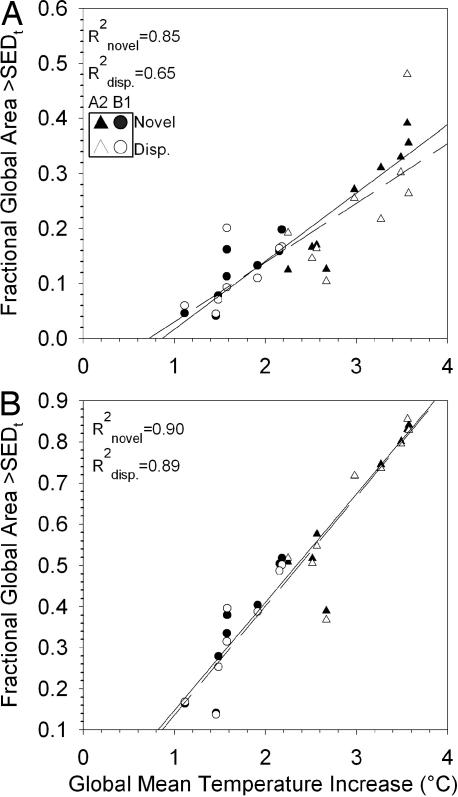
Fig. 4.
Plots showing the relationship between global mean annual warming and the fractional global area with novel and disappearing climates. Each point represents an individual model; triangles represent A2 simulations, and circles represent B1 simulations. Filled symbols and the solid regression line represent risk indices for novel climates (corresponding to Figs. 2 C and D and 3 A and B); open circles and the dashed line represent risk indices for disappearing climates (corresponding to Figs. 2 E and F and 3 C and D). A2 and B1 scenarios are pooled for the regression model. (A) Search for climatic analogs is global (no dispersal constraint). (B) Search for analogs restricted to within 500 km (500-km dispersal constraint).

