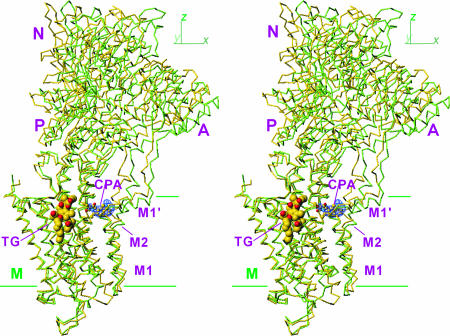
Fig. 1.
Superimposition of E2(CPA) and E2(TG+BHQ), which represent the two most distant structures in the five E2 crystals. Cα traces are viewed in stereo along the plane of the lipid bilayer (i.e., xy-plane). Two structures are fitted with the M7–M10 transmembrane helices. Yellow, E2(CPA); light green, E2(TG+BHQ). TG is shown in space fill, and CPA is in ball-and-stick. The blue net shows an ∣Fobs∣ − ∣Fcalc∣ electron density map (contoured at 5σ) before introduction of CPA in the atomic model. Three cytoplasmic (A, N, and P) and transmembrane (M) domains are marked.

