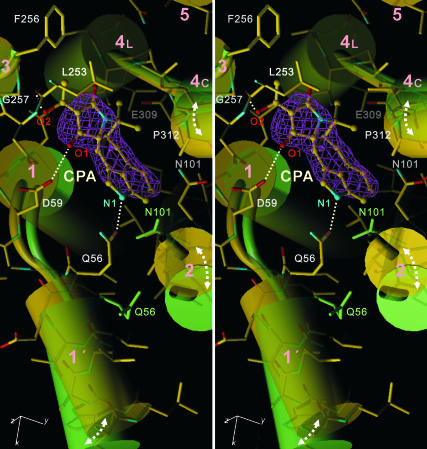
Fig. 3.
The CPA binding site in E2(CPA+CC) superimposed with that of E2(TG+BHQ) viewed in stereo approximately perpendicular to the membrane. Yellow, E2(CPA+CC); light green, E2(TG+BHQ). Cylinders represent transmembrane helices (M1–M5). The pink net represents an ∣Fobs∣ − ∣Fcalc∣ electron density map at 2.8-Å resolution contoured at 4σ before CPA (shown in ball-and-stick) was introduced into the atomic model. Dotted lines show likely hydrogen bonds. The atomic model is shown in stick representation for E2(CPA+CC). Side chains of Asn-101 and Gln-56 also are shown for E2(TG+BHQ).

