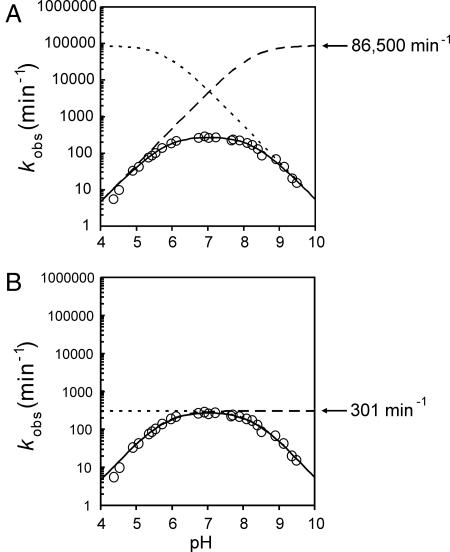
Fig. 4.
Two equivalent models of general acid–base catalysis for the VS ribozyme RG. Values for k1 and both apparent pKa values were estimated by fitting RG cleavage data to the model in Fig. 1C (18). Dotted and dashed lines, respectively, represent titrations of the general and base individually. Solid lines are the product of both individual titrations and k1. Data are open circles. (A) Overlapping model where the pKa of the acid is 5.8, the pKa of the general base is 8.3, and k1 is 86,500 min−1. (B) Nonoverlapping model where the pKa of the acid is 8.3, the pKa of the general base is 5.8, and k1 is 301 min−1.

