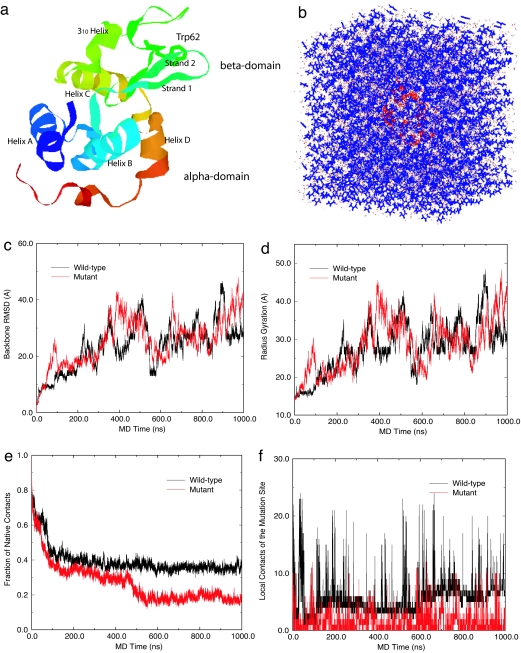
Fig. 1.
System and simulation results. (a) Ribbon view of the native lysozyme protein, with residue Trp-62 represented in sticks and both α- and β-domains marked. (b) Solvated lysozyme in 8 M urea solution, with protein lysozyme represented as red ribbons, urea as blue sticks, and water as white sticks. (c) Comparison of the backbone rmsd for the wild-type and mutant lysozymes. (d) Comparison of the radius gyration. (e) Comparison of fraction of native contacts. (f) Comparison of local contact of the mutation site (residue 62).

