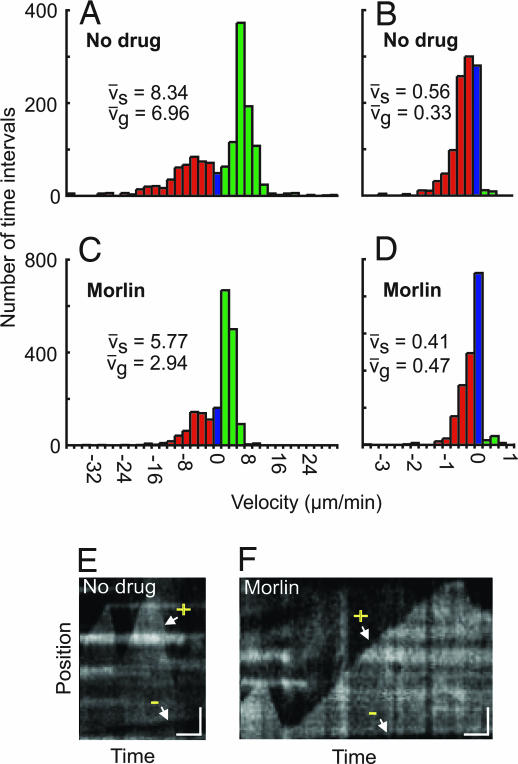
Fig. 3.
Morlin inhibits microtubule dynamicity. (A–D) Growth (vg) and shrinkage (vs) velocities for the leading (A and C) and lagging ends (B and D) of single microtubules in 3-d etiolated hypocotyl cells treated with 0.2% DMSO (A and B; 34 and 21 polymer ends tracked, respectively, n = 1,442 and 2,127 2-s time intervals, respectively) or 0.2% DMSO plus 50 μM morlin (C and D; 27 and 19 polymer ends tracked, respectively, n = 1,966 and 2,045 2-s time intervals, respectively). Velocities were calculated by kymograph analysis. Histograms are color coded for growth (green), pause (blue), and shrinkage (red). Mean velocity measurements are noted within each figure component. Distributions of vg and vs at both the leading and lagging ends were significantly different between control and morlin treatment (P < 0.001), as calculated by using the Wilcoxon rank-sum test. (E and F) Representative kymographs for control (E) and morlin treatment (F). After morlin treatment, the rates of both plus end (+) growth and shrinking decrease, as does the rate of minus end (−) shrinking, resulting in inhibition of dynamicity at both polymer ends. (Vertical scale bar, 2 μm; horizontal bar, 0.5 min.)

