Fig. 1.
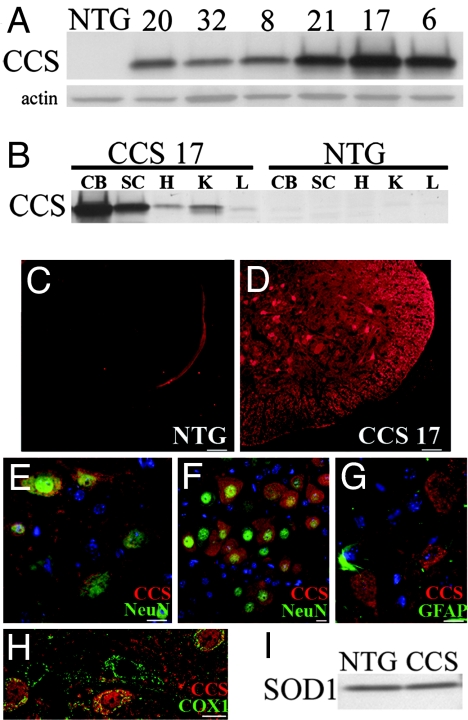
Characterization of CCS transgenic mice. (A) Western blot of spinal cord extracts from CCS transgenic lines (20, 32, 8, 21, 17, 6) showing CCS expression levels compared with a nontransgenic (NTG) mouse. Actin was used as loading control (20 μg of protein per lane). (B) Tissue distribution of CCS protein in 24-day-old line 17 CCS transgenic mouse versus NTG mouse on Western blot. CB, cerebellum; SC, spinal cord; H, heart; K, kidney; L, liver (20 μg of protein per lane). (C–H) Immunohistochemical studies of CCS expression in spinal cords of 26-day-old line 17 CCS mouse and NTG littermate. Spinal cord sections from NTG (C) and CCS (D) mice stained for CCS with identical exposure times. Merged images of CCS (red) and NeuN (green) staining in spinal cord ventral horn (E) and hypoglossal nucleus (F) from CCS mouse. Merged image of CCS (red) and GFAP (green) staining in spinal cord ventral horn (G) from CCS mouse. Merged confocal image of CCS (red) and COX1 (green) staining in spinal cord ventral horn (H) from CCS mouse. (I) SOD1 levels in spinal cord extracts from 30-day-old NTG and CCS mice (10 μg protein per lane). (Scale bars: C and D, 50 μm; E, G, and H, 20 μm; F, 10 μm.)

