Figure 6.
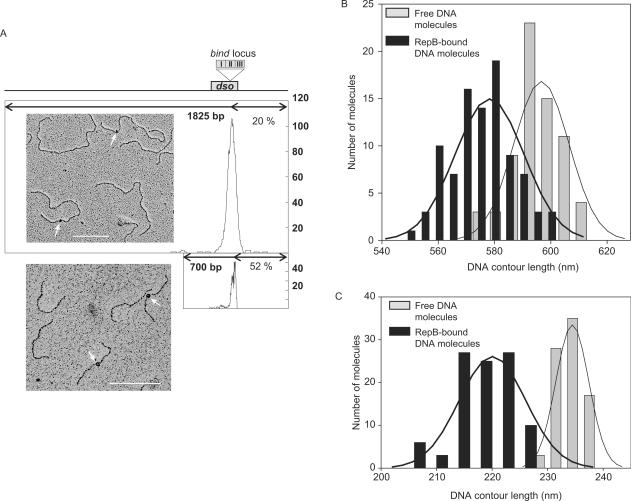
EM of RepB-DNA complexes. (A) Distribution of the location of the RepB-DNA complexes from one end of the 1825-bp or 700-bp fragments. The length of the DNA fragments is represented by a thick line. RepB is located 20% (365 bp) from the closer end of the 1825-bp DNA, and 52% (365 bp) from one end of the 700-bp DNA. Since the bind locus is nearly centred in the 700-bp fragment, the peak observed is unsymmetrical. On top of the figure, a scale scheme indicates the position of the pMV158 dso, and the insert shows the bind locus. Alongside, micrographs of the 1825 bp and 700 bp fragments after incubation with RepB are shown. Arrows indicate RepB bound to the bind locus of the dso. Bar indicates 200 nm (about 600 bp). (B), (C) Contour length distribution of protein-free and RepB-bound DNA molecules. Histograms show the contour length of free (grey bars) and bound (black bars) DNA molecules of two different sizes: 1825 bp (B) and 700 bp (C). The Gaussian fit to the distribution is represented by the solid lines, and the statistics of the contour length determinations is shown in Table S1.

