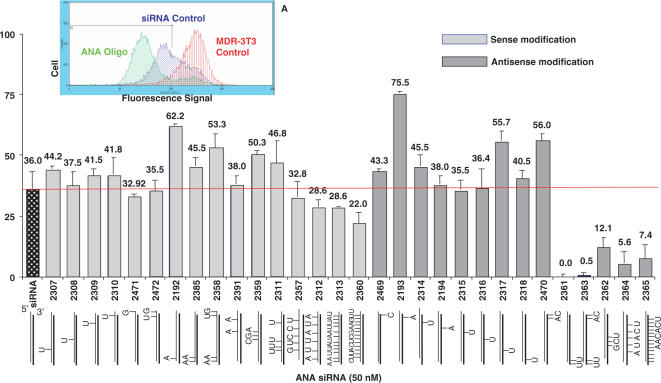
Figure 2.
Screening of ANA-modified siRNAs for activity versus MDR1. NIH 3T3-MDR cells were treated with 50 nM ORF1 sequence siRNA complexed to lipofectamine 2000 for 4 h at 37°C in complete medium. Thereafter the cells were placed in fresh medium (2% FBS/DMEM-H) and cultured for an additional 72 h. Cell surface P-glycoprotein levels were quantitated by immunostaining and flow cytometery as described in methods. Results are expressed as the percentage reduction in Pgp expression compared to untreated control cells. The positions of the ANA modifications are indicated in the figure. Results are means of three determinations. Figure 2 inset: a typical flow cytometry analysis is shown comparing Pgp levels in untreated control cells with cells treated with ANA-modified or control (unmodified) siRNAs. In this and subsequent figures unmodified anti-MDR1 siRNA is designated simply as ‘siRNA’ or ‘siRNA control’.

