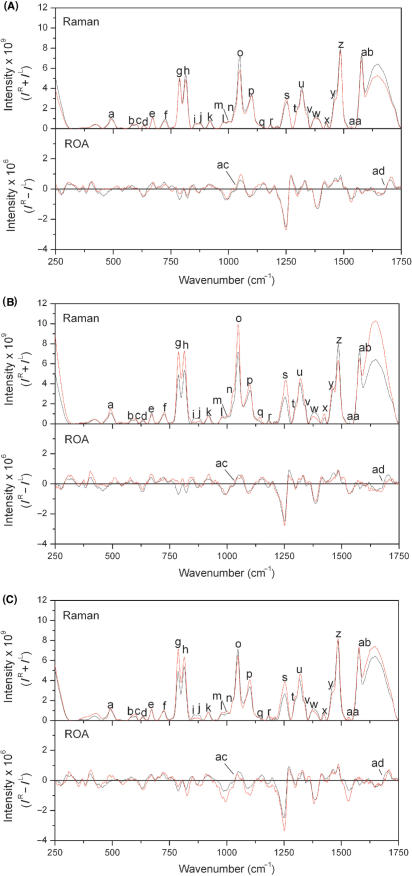
Figure 3.
Raman and ROA spectra for all oligonucleotides. Pairwise comparisons of baseline corrected and normalized Raman (top panel) and ROA (bottom panel) spectra for Hairpin RNA (black) and (A) Mismatch RNA, (B) Bulge RNA and (C) EMCV RNA (red). The letters identifying each peak in the spectra correspond to those given in Table 1.

