
Figure 2.

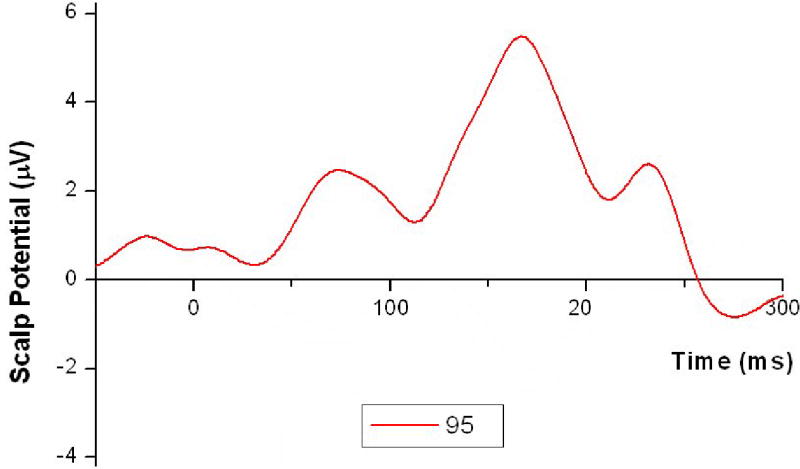

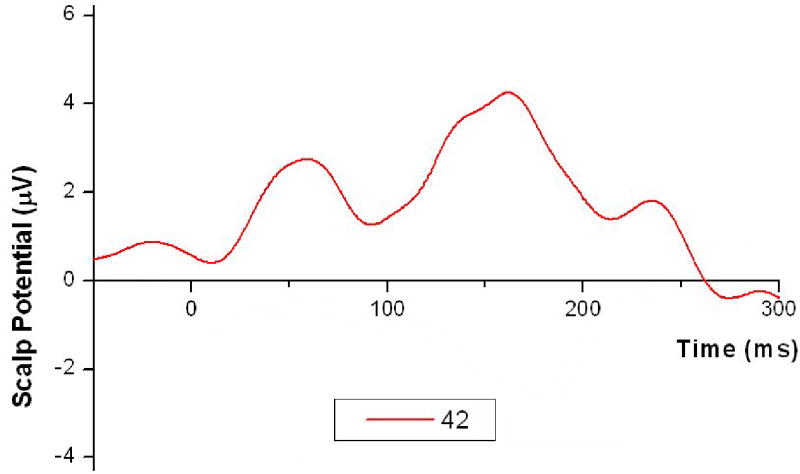
Examples of topographic maps of the earliest VEP component and typical waveforms (subject 1): (a) a topographic potential map for protocol L9 (t = 73 ms) and the area of interest; (b) waveforms at electrode 95, which is marked in (a); (c) a topographic map for protocol R3 (t = 59 ms); (d) waveforms at electrode 42, which is marked in (c). Tessellated cortical surface and boundary element model were visualized together with the topographic maps.