
FIG. 2.
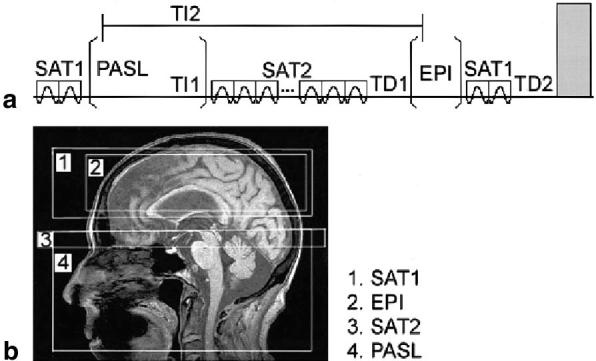
(a) Perfusion imaging sequence and (b) arrangement for perfusion imaging. Indicated are spin saturation (SAT1 and SAT2), PASL, and EPI acquisition periods. TI1 and TI2 are spin inversion times, and TD1 and TD2 are delay times that determine overall TR. Transparent squares indicate slab-selective gradients, and the gray area indicates a spoiler gradient.