
FIG. 6.
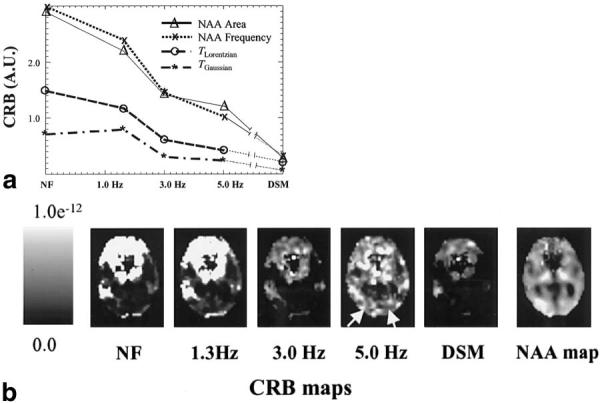
a: CRB values from fits of in vivo MR spectra as a function of spectral filtering. Results are averaged from 406 1H MR spectra of white matter from a 72-year-old patient with AD. CRB values are calculated for NAA area, NAA frequency, and a combination of Lorentzian (TLor,) and Gaussian (TGauss) signal decays. b: Regional distribution of CRB values for the NAA area from the same MRSI data as above. Arrows indicate increased CRB values from heavy (5.0 Hz) apodization filtering, which is not observed with DSM or mild apodization filtering.