
Figure 2.
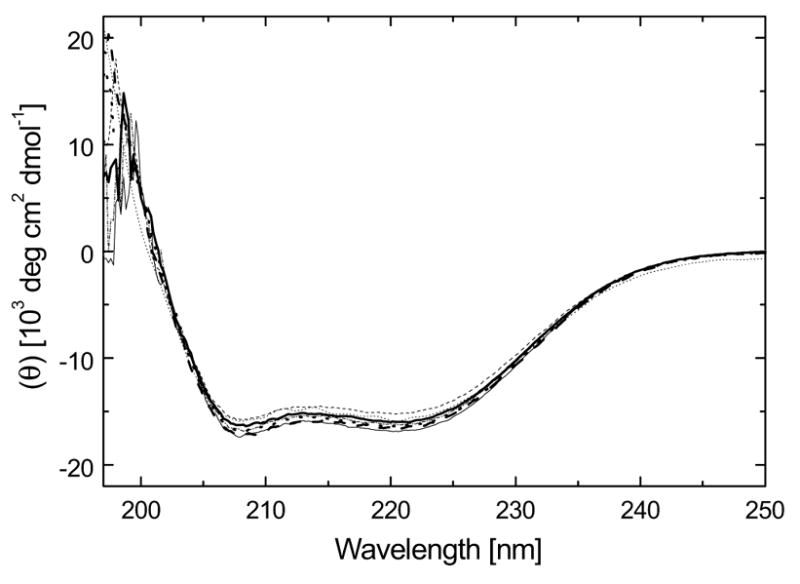
Far-UV circular dichroism (CD) spectra of ClpB and its mutant forms at room temperature. The CD signal is expressed as mean molar residue ellipticity (θ) and shown for wt ClpB (thick solid line), K212T (thick dashed line), K611T (thick dotted line), D797A (thin solid line), R815A (thin dashed line), R819A (thin dotted line), E826A (dot-dashed line). The protein concentration was 2.0 mg/ml in 50 mM Hepes-KOH, pH 7.5, 0.2 M KCl, 20 mM MgCl2, 1 mM EDTA, 2 mM β- mercaptoethanol.