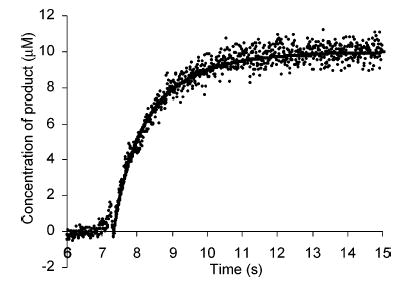
Figure 1.

Measurement of the photoluminescence in a spectro-fluorometer as a function of time following mixing of 20.0 μM 13+ and 20.0 μM dopamine. The rise time of the signal here is ~4 s, which varied from 1 to 4 s depending on the analytes. The resulting photoluminescence intensity was converted to the amount of 12+ produced (points). Nonlinear fitting of data (solid line) revealed the reaction rate constants summarized in Table 1.
