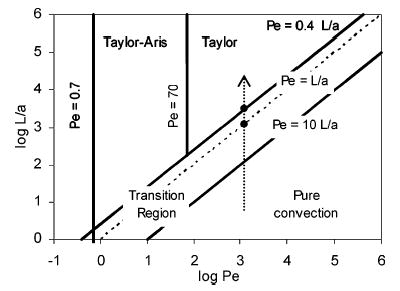
Figure 2.

Diagrammatic representation of various solution dispersion regimes. The arrow indicates the positions for the mixed flow in our experiments, traveling at 1.7 cm/s along a 50-μm capillary (Pe ~ 1200). Two dots are at lengths of 3.0 and 8.0 cm, respectively. Adapted and modified from Figure 4.6.5.41
