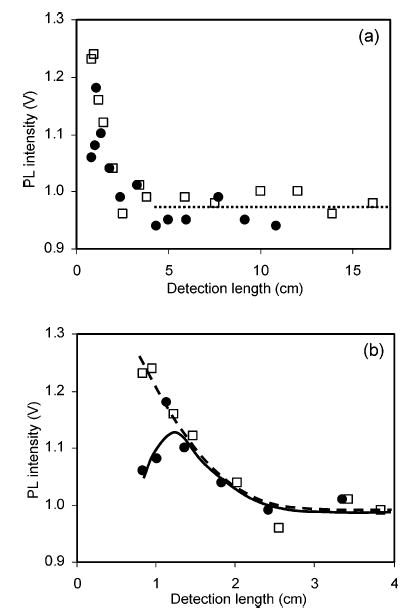
Figure 3.

Photoluminescence (PL) signal intensity at different detection lengths when 10.0 μM p-hydroquinone was mixed with 2.0 μM 12+ (□, dashed line) and 13+ (•, solid line) in a flow system, (a) overall and (b) blow-up. Both 12+/13+ show PL decreasing to the same steady-state value (dotted line in panel a).
