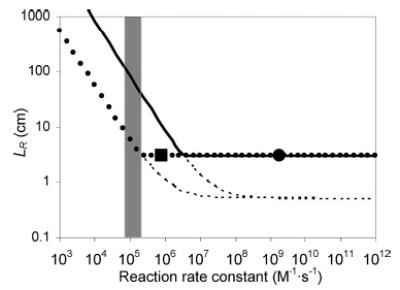
Figure 7.

Plot of LR as a function of second-order reaction rate constant, k. For a reaction of A + B → P at [A] = 1 μM and [B] = 0.5 μM (solid line), and 2A + B → 2P at [A] = 1 μM and [B] = 5 μM (dotted line), where [C] denotes concentration of C in the mixed flow. The extent of reaction defining 〈tR〉 (from eq 2 or 4) is 95%. The dashed lines denote (〈ts〉 + 〈tK〉)v for each reaction condition (refer to eq 14). The reaction rate constants of 2 (1.7 × 10⁹ M−1·s−1, calculated) is represented as a dot and that of p-hydroquinone (8.04 × 10⁵ M−1·s−1, measured) as a square. Rate constants of catechols lie in the shaded area.
