
Figure 4.
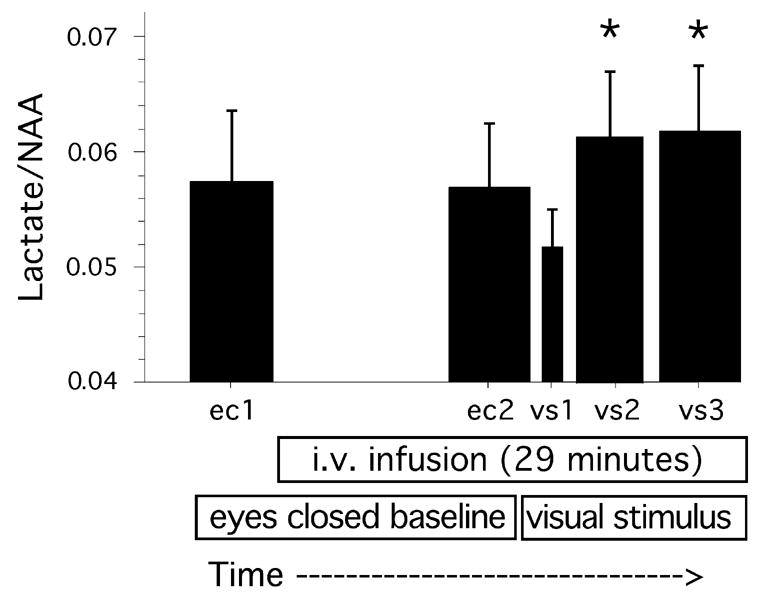
The effect of visual stimulation on Lactate/NAA levels, across glycemic conditions (F = 4.3, df = 4, 20, P = 0.011). *Post hoc tests showed that Lactate/NAA was significantly higher during VS2 and VS3 than during EC1 and EC2 (all P <0.05, see text). Durations: VS1 = 0.8 minutes, VS2 = 4 minutes, all other conditions = 4.8 minutes. EC = eyes closed, VS = visual stimulation. Note that Y axis scale does not begin at zero. Mean and s.e.m. values are shown.