
Figure 7. Energy landscapes of the naturally-occurring Notch ankyrin domain and the C-terminally stabilized construct.
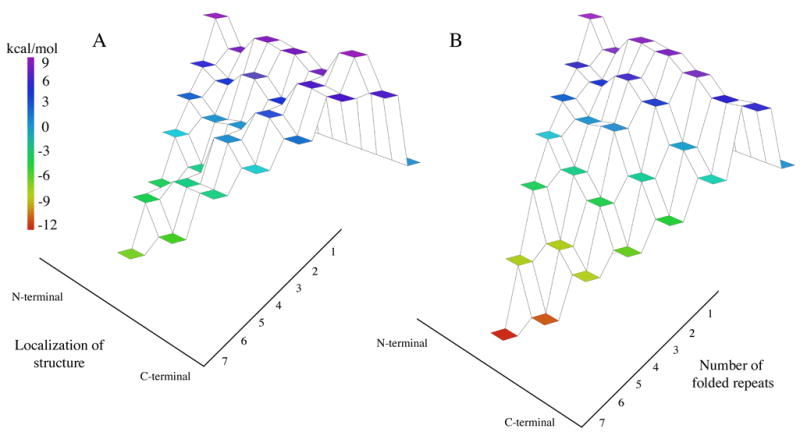
Nank1-7* (A)12 and Nank1-5C2 (B). The vertical axis indicates free energy relative to the denatured state (represented as a flat tier set to zero free energy), and is indicated by coloring. The right axis indicates the number of folded repeats, and the left axis indicates structure localization going from the N-terminus (left) to the C-terminus (right).